B2B SaaS · Lead UX Designer · 12 Weeks · 2023–2024
VEERUM
How I built a design practice from scratch and made industrial asset tagging 11× faster — without a single line of new infrastructure.
Role
Lead UX Designer (sole designer)
Timeline
May 2023 – May 2024
Industry
B2B SaaS · Industrial
Key outcome
11× faster asset tagging
Background
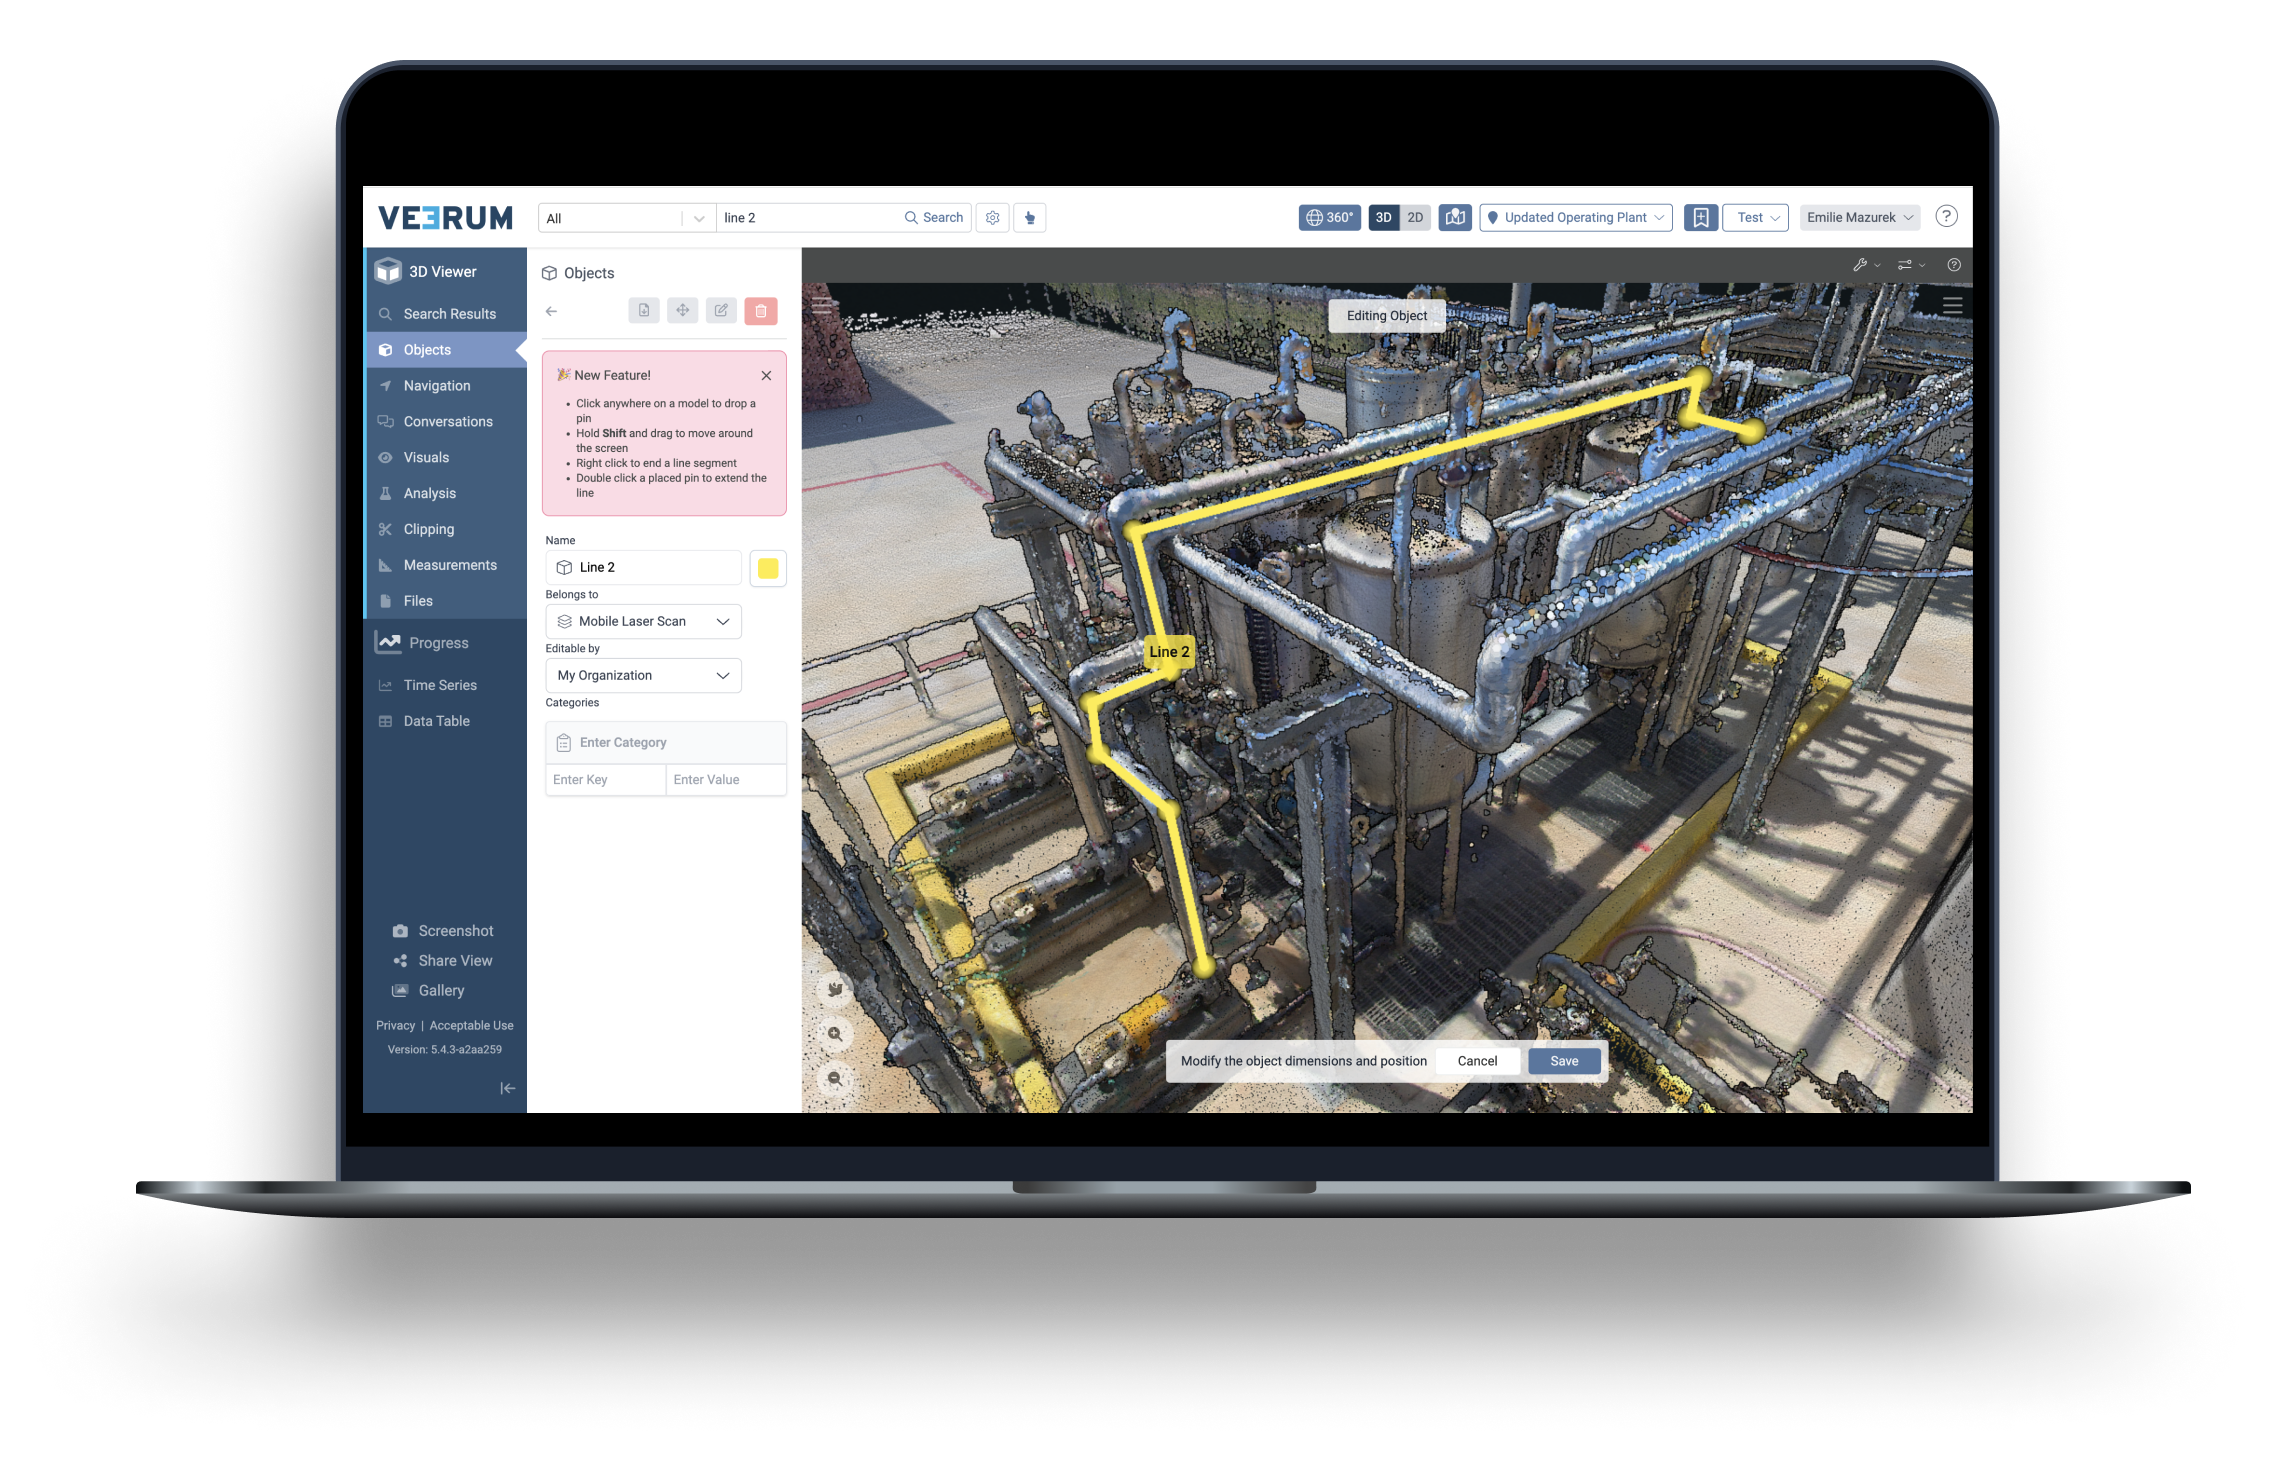
VEERUM digitizes entire industrial facilities into navigable 3D environments — letting contractors tag and document assets from a browser, anywhere in the world. I joined as their first and only designer, tasked with building a design practice from scratch and introducing user research to the product for the first time.
The linear objects project was one of the most impactful things I shipped there.
Understanding the problem
Imagine you work at an oil and gas facility. To document what's out there, someone has to physically go to the site. That means getting certified to even set foot there, flying out — often somewhere remote up north — driving the rest of the way, suiting up in full safety gear, and then walking around with a stack of paper documentation trying to figure out what's what. Cold weather, hazardous conditions, the works. And if you missed something or made a mistake? You're going back.
VEERUM completely changed this. They digitized entire facilities into 3D environments that anyone could navigate from a computer. Suddenly, contractors sitting in India could tag sites in the US they'd never visited in person. No flights, no PPE, no paper. Just a browser.
Yet the tool still had a major gap. The only way to tag assets was using 3D cubes — which worked fine for boxy equipment, but was a nightmare for anything linear. Think pipes, cables, conduit. Assets that stretch and wind across an entire facility. To tag a single pipe, you'd have to line up fifteen individual cubes end to end, each one a poor fit. Multiply that across every linear asset in a plant, and the hours add up fast.
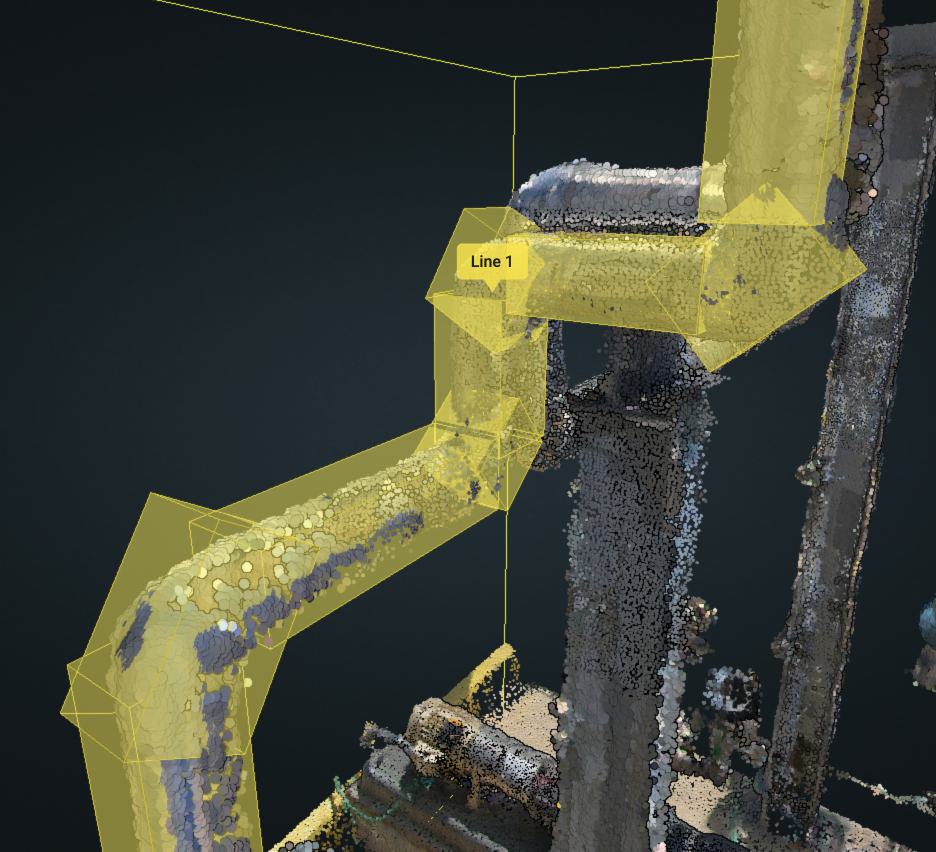
Fifteen separate cube objects had to be individually placed to tag a single pipe. Close up you can see what a poor fit this provides.
"Take Sulfur Plant 1, which took me three months to get done. If they could do that in a week we would do the whole plant."
— Client interview participantHow might we increase the tagging speed of linear objects so that clients can improve productivity and reduce the cost of getting set up in VEERUM?
Ideation
I started by talking to the people on the team who worked directly with clients — they already knew this problem inside and out. But I also knew that having strong opinions for a long time doesn't always make those opinions right. So before committing to a direction, we went directly to clients at companies like Imperial Oil, Suncor, and Exxon to validate what we were hearing. We spoke with approximately 11 people across enterprise clients — asking whether they were outsourcing because the tool was too tedious, and whether they'd do it themselves if it was easier. The research confirmed both.
I also looked at how other tools handled similar problems — anything that required users to trace or map complex shapes. Then I brought three directions to the table:
- Option 1 — Multiple bounding box mode: Chain the existing cubes together so users could extend them without starting over. Familiar, but still slow and finicky. Not a real fix.
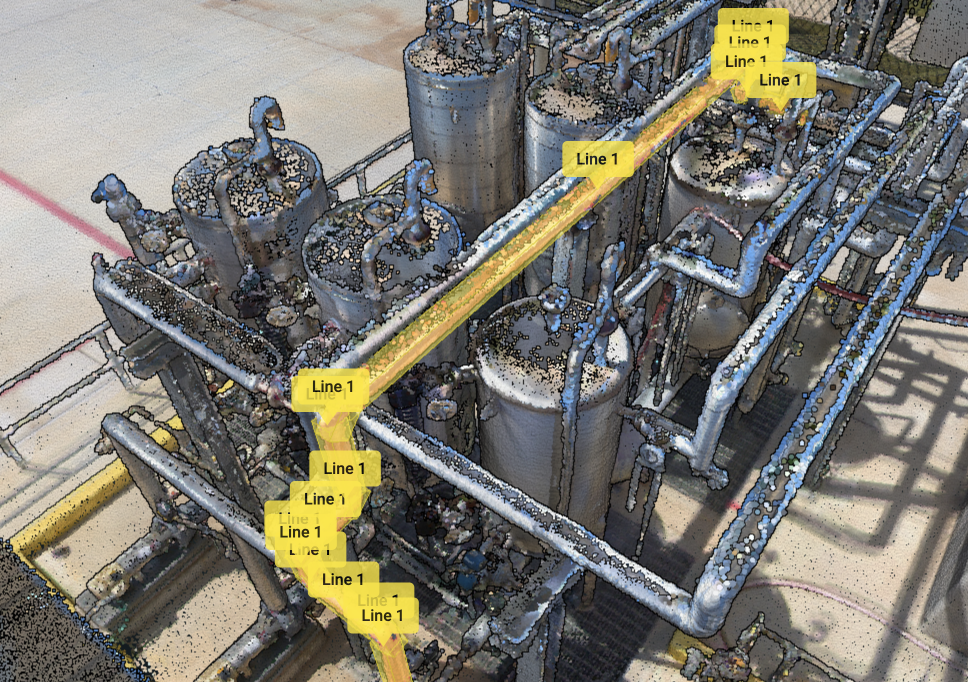
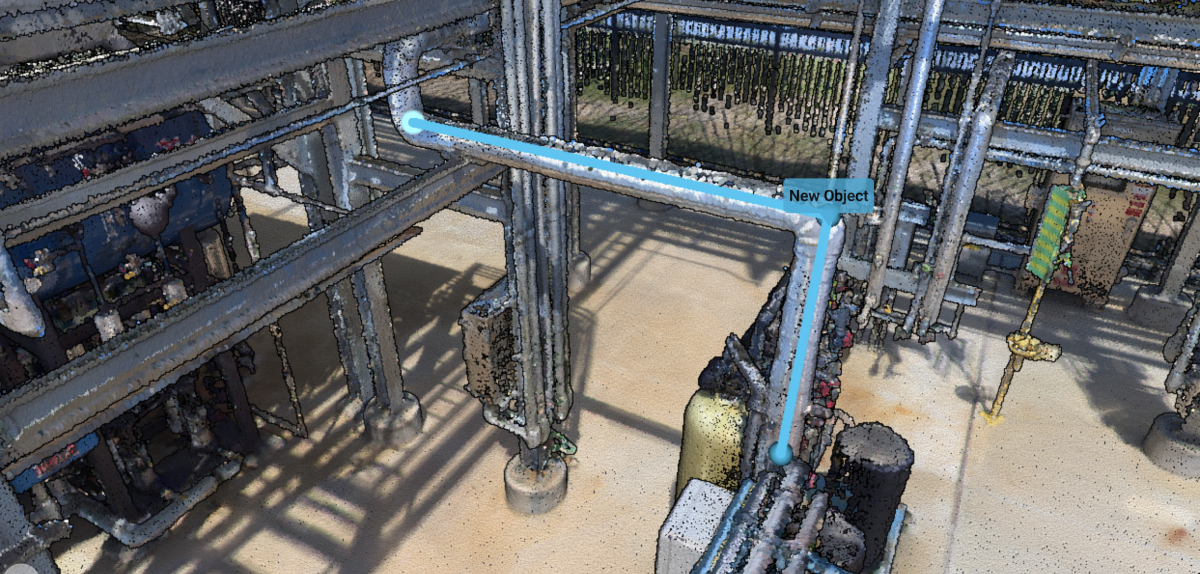
- Option 2 — Click points along a line: Drop pins along an asset and the tool connects them. Fast and intuitive, and it would actually follow the shape of a pipe or cable. The tradeoff: the pins sit on the outside of the object, so measurements wouldn't be perfectly precise.
- Option 3 — AI asset detection: Click a button, asset gets detected automatically. Not feasible — the R&D team had been working on it with little progress.
While talking through these options with the dev team, they mentioned that VEERUM already had a measurement tool that worked almost exactly like option 2. That functionality basically already existed — it just needed to be extended so objects could be named, saved, and exported like the cube tool. Option 2 wasn't perfect, but AI detection wasn't on the table, and building on something that was already there meant the effort was low. For a problem that had been around this long, getting something fast and usable out was going to be a big deal. We went with it.
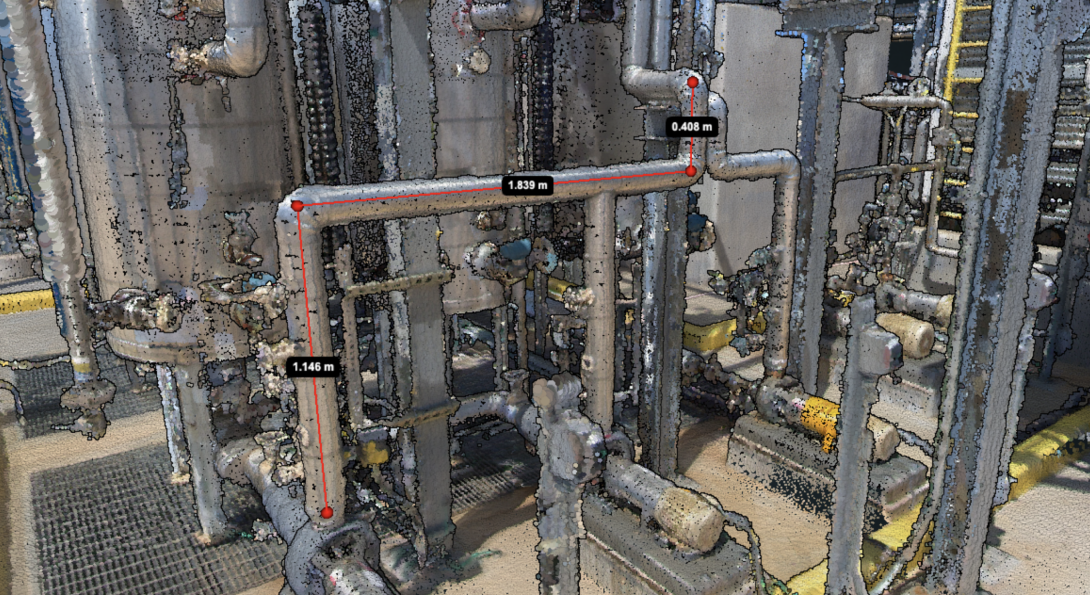
The existing measurement tool — nearly everything we needed was already there. It just couldn't save, name, or export objects yet.
Designing & testing
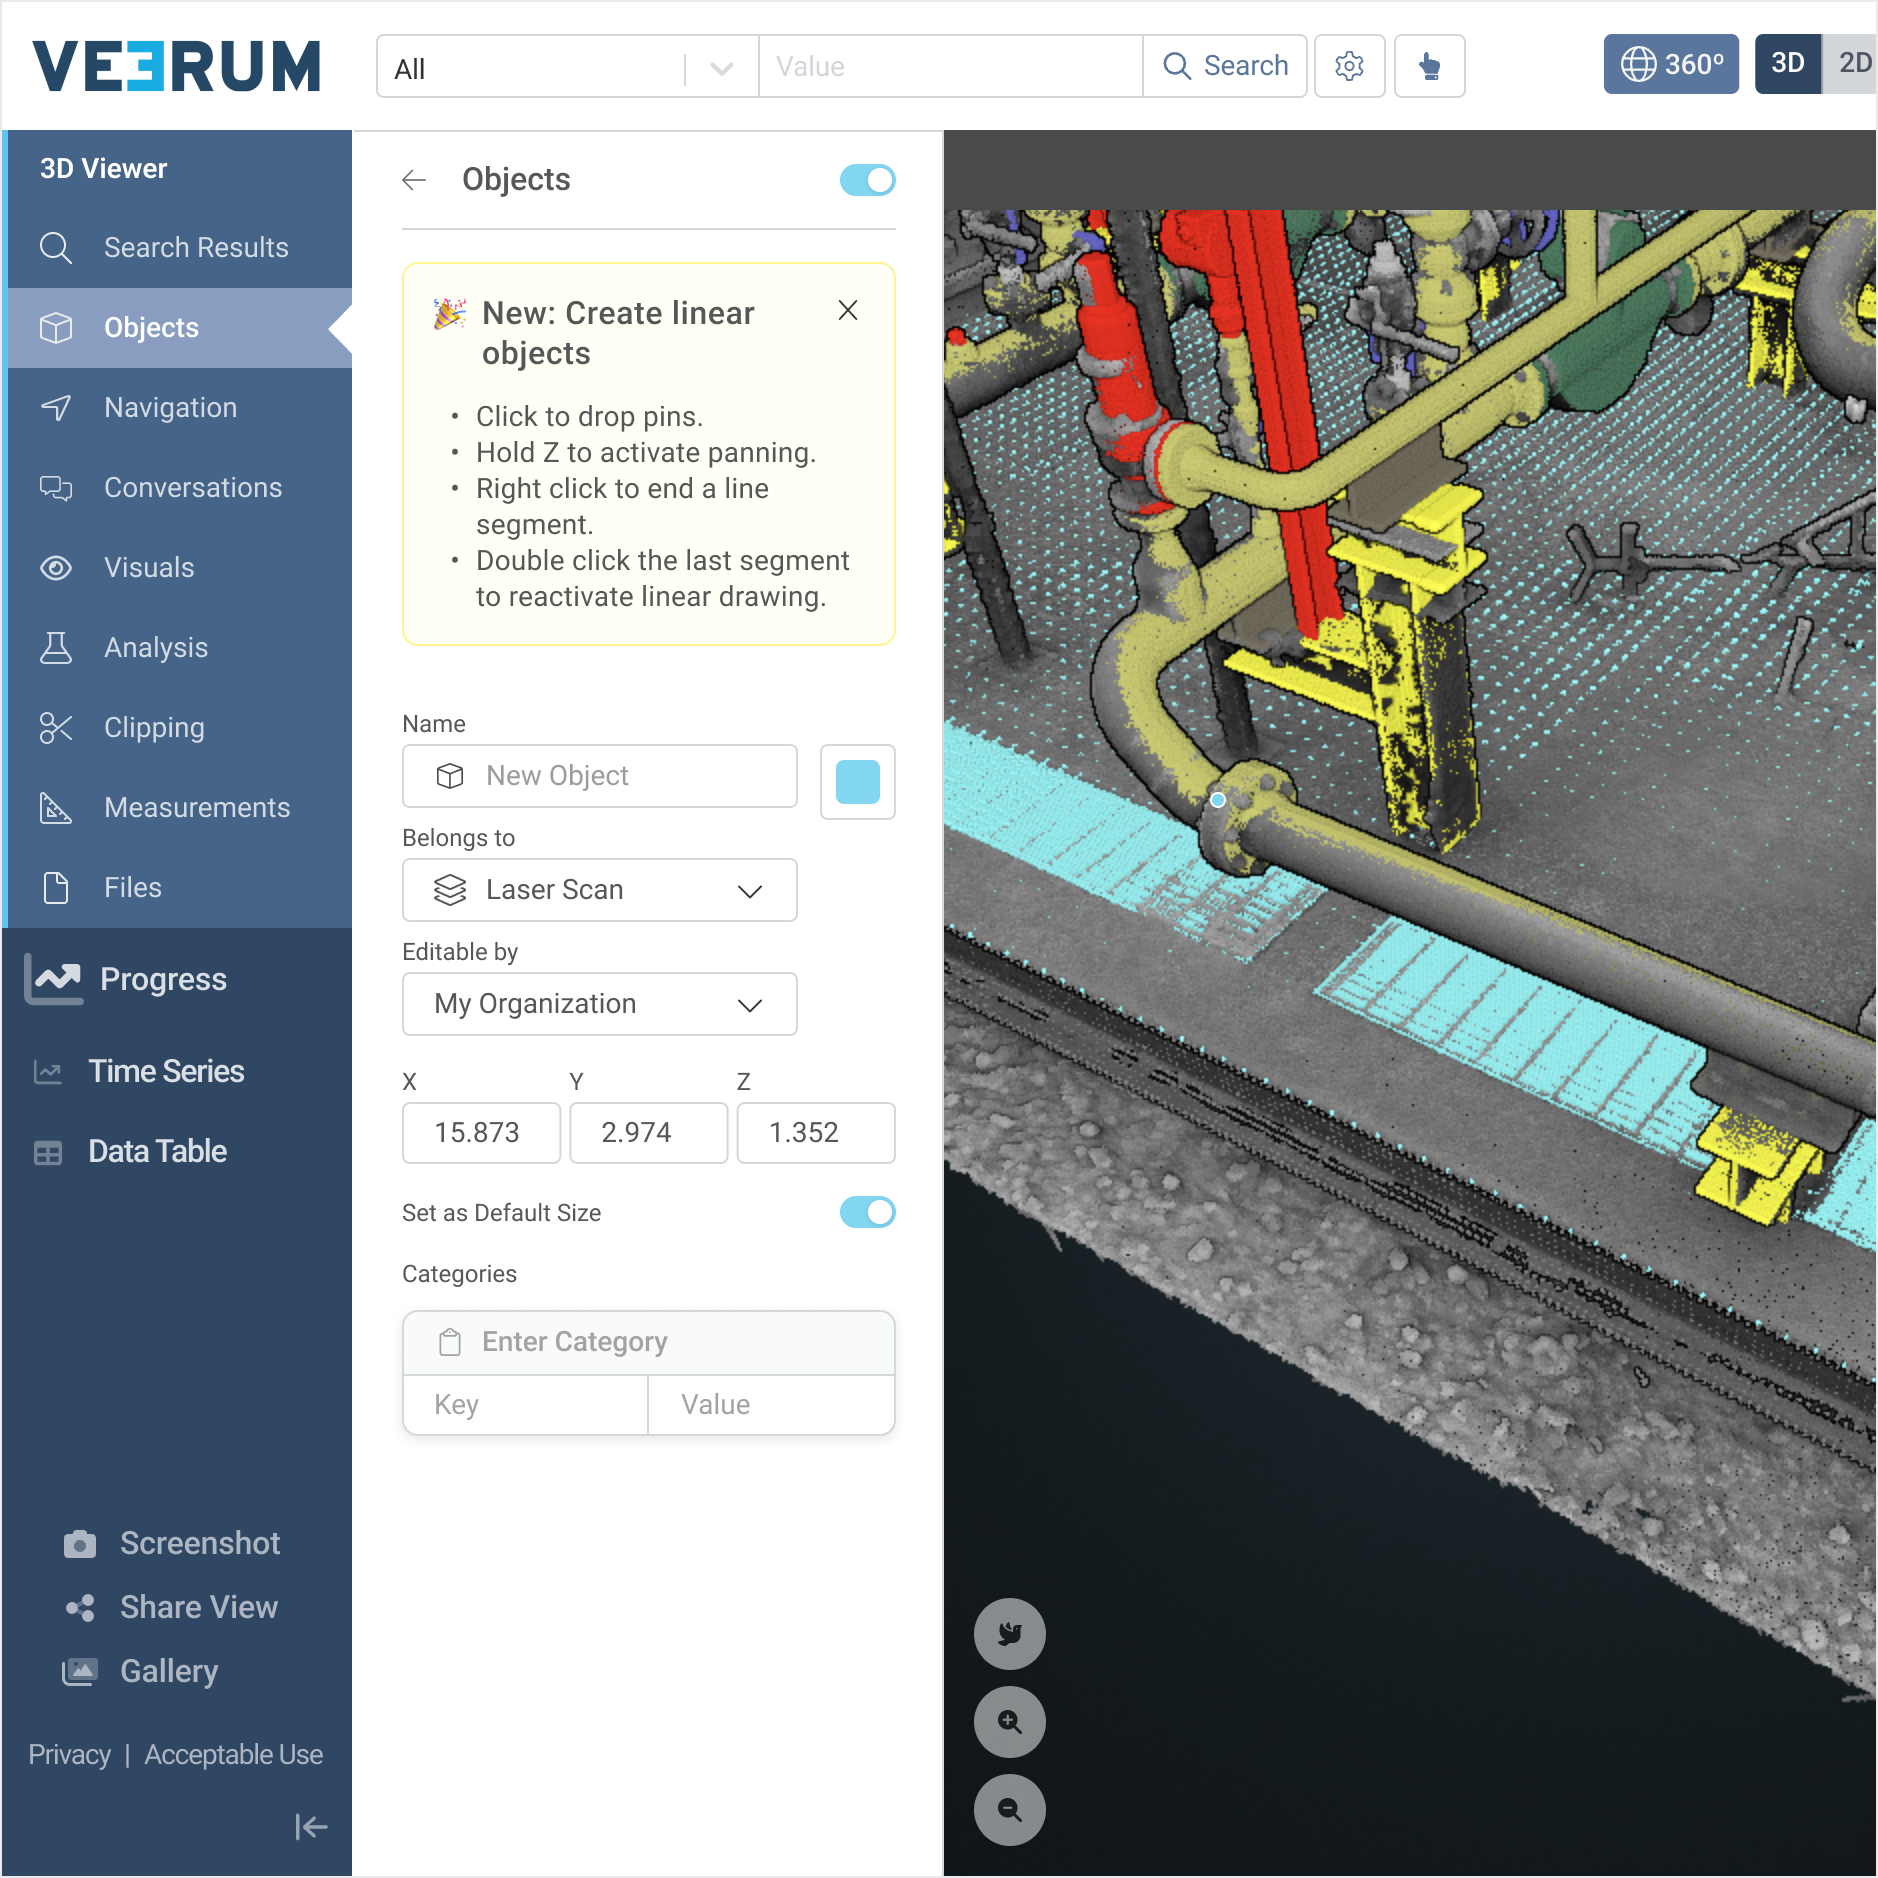
One thing that made prototyping tricky: you can't really simulate a 3D spatial tool in Figma. So instead of a standard clickable prototype, I worked closely with the dev team to build something functional directly in the dev environment. Scrappy, but real enough to test.
We ran two rounds of usability testing with seven internal participants total. Getting the actual contractors who did the tagging — mostly based in India — to participate proved too difficult given the time difference, so we tested internally instead. Three things came up consistently:
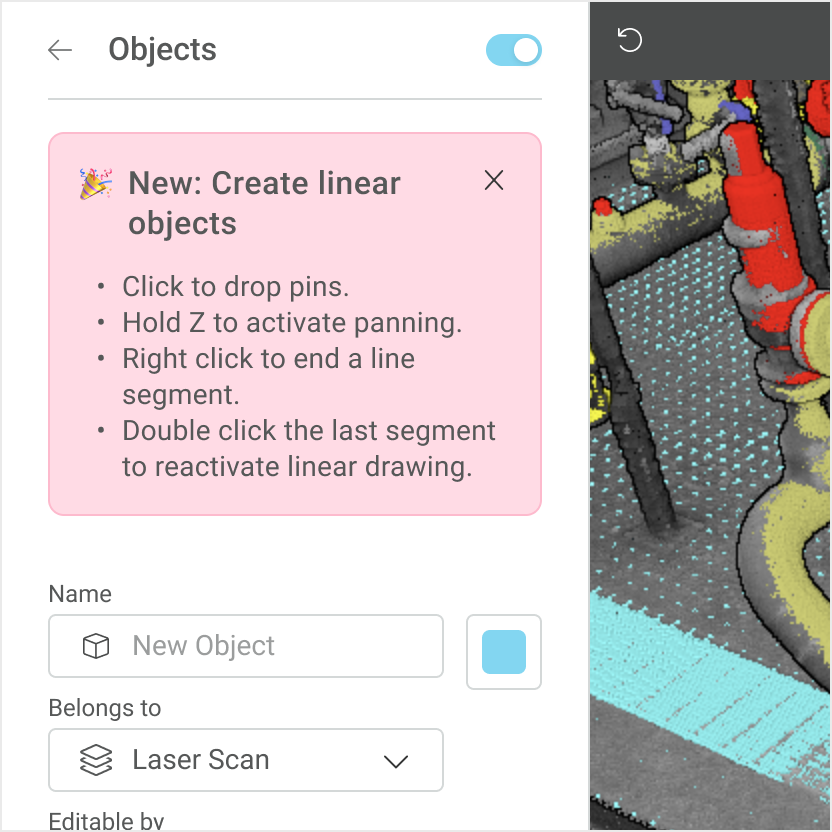
Finding 01
Users expected to keep going after finishing
Before
After
Six out of seven testers tried to add more pins to a completed object, which the original design didn't allow. We updated it so users could double-click to reopen an object and keep extending the line.
Finding 02
Rotating the model while dropping pins was confusing
In VEERUM, clicking and dragging rotates the 3D view — but in the linear object tool, clicking drops a pin. Five out of seven testers got stuck here. There wasn't a clean way around it. We added an undo button, which gave people a safety net while they got their bearings. Once they did, it stopped being an issue.
Finding 03
Users wanted to see their work in 360° Pano mode
Before
After
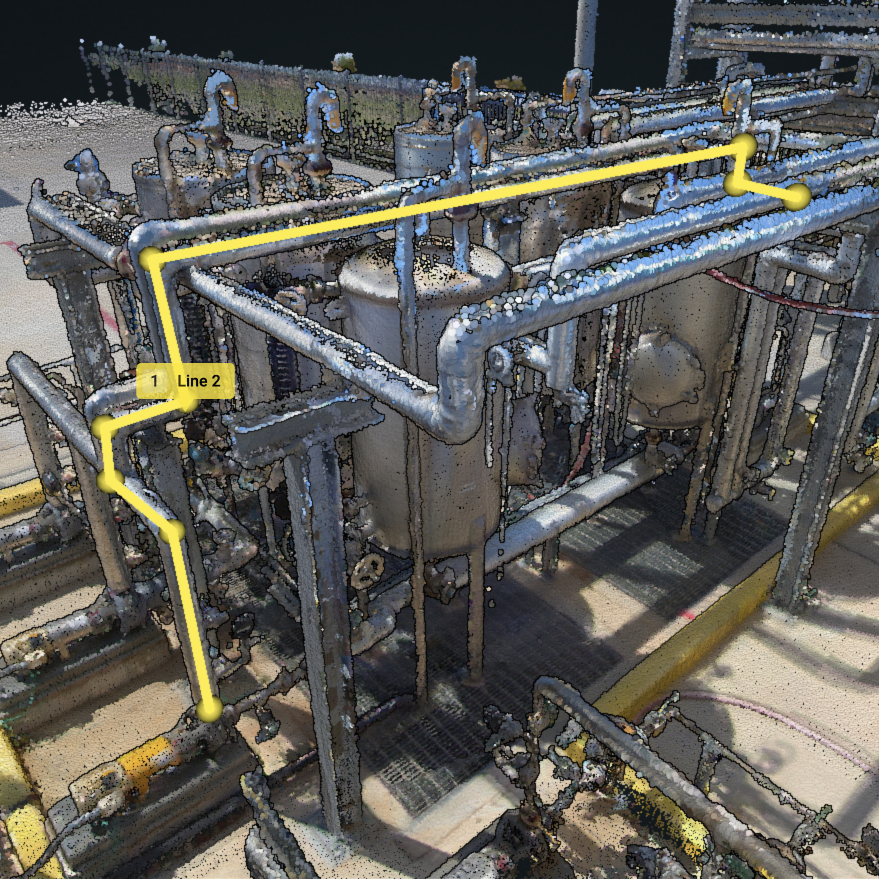
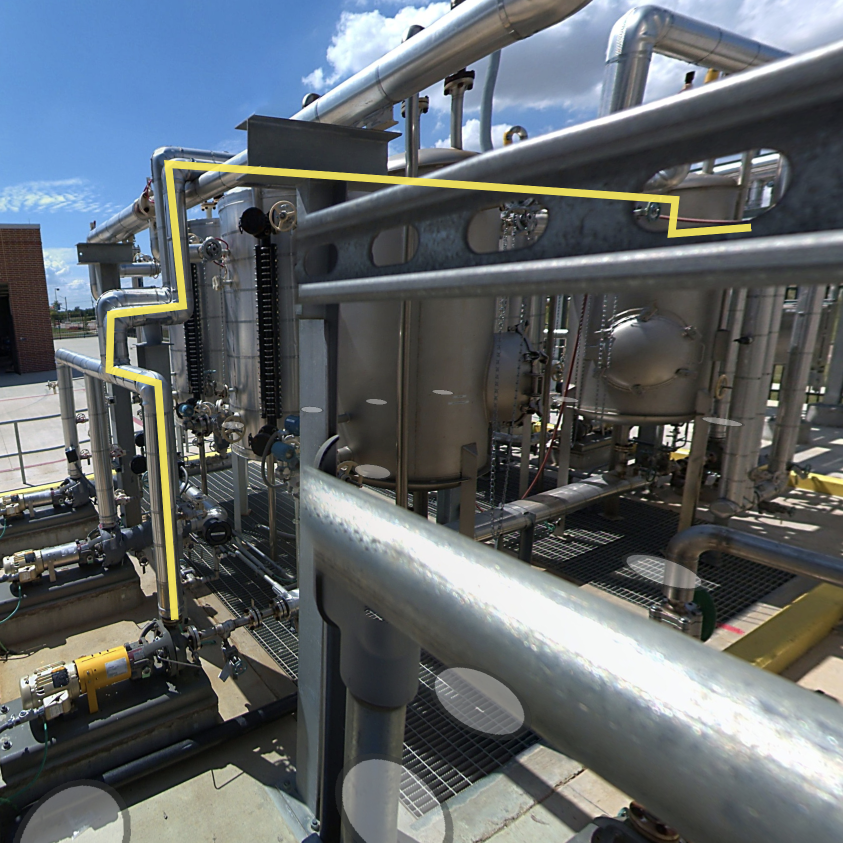
VEERUM has two main views: the 3D point cloud and 360° Pano mode, which shows what the site actually looks like in real life. Three out of seven testers asked whether linear objects would show up in Pano mode — the view most people preferred day-to-day. We hadn't built that yet. We did.
Impact
11×
faster tagging — 13 min 46 sec down to 1 min 24 sec per asset
22%
of all objects placed, up from 2% the month of launch
To me, impact isn't just about moving the numbers. I made the decision to bring the lead developer into every usability testing session — because we were already building the prototype together, it was a natural extension of how we were collaborating. What it meant in practice was that findings never had to travel through me. The person building the product was in the room watching real people use it in real time. Changes got made faster, with full context. It's a practice we carried into every project after this one.
I also used this project as an opportunity to introduce research more formally across the company. As VEERUM was shifting toward a product-led approach, I shared the findings in a company-wide presentation — bringing in people who wouldn't normally be part of the process. It helped build credibility in how we were making decisions, and it brought some of the skeptics along too.
Retrospective
Data over opinions. Early on, there was a lot of internal energy around this feature — it had been on the roadmap for years, and executives called it a game-changer. What this project taught us was that having benchmarks and metrics in place before building something isn't optional — it's how you make smart decisions about what to work on next. When we looked at the data after launch, we could see that while linear objects meaningfully improved tagging, the Objects area of the app wasn't as heavily used as other parts of the platform. That data informed the decision to pause the next iteration and redirect our energy elsewhere. Instead of chasing the loudest voice in the room, we let the evidence decide.
Research changes the room. Introducing user interviews and usability testing in a more structured way — and sharing those findings openly across the company — shifted how the team thought about making product decisions. When people can see the evidence behind a choice, you don't have to convince them. They're already with you.